Industry Trends
Analysis Categories
The trend in industry GRP, Employment Total, Earnings, and Tax Revenue by industry sectors for Erie County for years 2010 through 2022. Tax Revenue reflects federal, state, county, local, and special taxes earned on production and import.
While some industry sectors outperform others in certain variables, it is important to weigh their impact by the variable at hand, and how important that is to the local economy.
GRP
County-wide, GRP is dependent on the Manufacturing sector, although it has shrunk from 25.1% to 21.5% in the past 12 years. While no one sector has captured that difference in GRP, the Finance and Insurance sector has grown by more than 2.5% since 2010.
Employment
Employment totals for Healthcare, and Social Assistance has the majority at 19.5% of all employment in 2022. While Manufacturing hovered over 14% to 17% for several years in the last decade, for the latest data year it sits at 14.8%.
Establishments
The Healthcare and Social Assistance sector, while accounting for Erie County's highest employment percentage, has fallen in establishment count in the last decade, once at 25.1% of all (2011) it now accounts for 19.8%. This can be attributed to consolidation and is not an outright negative indicator. Erie County saw a drop in Wholesale Trade (3.71% from 4.36%) but a rise in Accommodation and Food Services (9.08% from 8.08%).
Tax Revenue
Conversely to its Employment and Establishment contribution, Healthcare and Social Assistance represents only 5% in value add to the tax revenue dollars in 2022, whereas the Retail Trade sector is the leading contributor to the County's tax revenues at 29.2%. In the last decade, the portion of tax revenues from the Finance and Insurance sector has grown from 9.6% (2012) to 13.6% (2022).
EVS analyzes the data in each topic category using indicators, which report a targeted and digestible number, rate, or amount to represent Erie County as a whole. While this does not cover every aspect of the topic, it assists in establishing Erie's performance relative to the prior year(s). The indicators for the Business Industry Trends topic are:

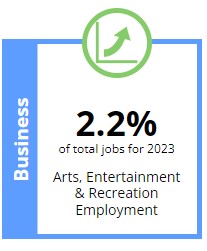
This indicator measures the total percentage of employees in Arts, Enterainment, & Recreation related businesses for the latest data year in all of Erie County. Arts and culture bring distinction and visitors to a region, and employment in the sector is a measure of the sector's financial strength and contribution to the local economy. The trend for Arts, Entertainment, & Recreation Employment is slightly up and better from 2022 to 2023, from 2.1% to 2.2% within the County.
This indicator measures the largest industry sector as a percent of the total Erie County market by output for latest data year. The largest industry sector in an economy is the determinant of that area's legacy in business and workforce skillset, and a change in such would mean a significant upheaval of the balance of the local economy and supply chain. The trend for Largest Industry as Percent of Total is down and worse from Rolling Railroad Stock and Manufacturing in 2018 to 2019, at 6.2% of the GRP, down -.2% from the previous year.
Analysis performed by Data Center on data from Lightcast, as of 5/2023.

